Stock Prediction Algoritm

Skills: Python, Machine Learning, Data Science, Excel
A machine learning algorithm that takes real time stock market data to analyze it and try to predict a stock's price in a certain period of time.

Objective

This project was a part of my fundamentals of data science class and was developed in a group of four people. The goal was to explore the application of machine learning techniques to predict stock prices for companies within the S&P 500 and various sector-specific ETFs. By using financial data sourced from Yahoo Finance, we developed and compared multiple machine learning models, including Random Forests Regression, kNN Regression, and Support Vector Regression, to assess their predictive accuracy. We wanted to determine the effectiveness of these models in predicting stock prices, providing insights into their potential use in financial analysis and highlighting the challenges associated with modeling the inherently complex and volatile stock market.

Data Analysis Process

Data Collection

Our dataset is sourced from Yahoo! Finance and it includes daily market statistics for the last 5 years. The timeframe is dynamically determined by the date on which the user runs the data. For instance, if a user executes the code on January 1st, 2024, the dataset will cover the period from that date back to January 1st, 2019. This design ensures that the dataset remains continually relevant, adapting to the specific date of user interaction. These are the key datasets included:
  • S&P 500 Companies: Historical prices for the full range of companies listed on the S&P 500.
  • ETFs: Historical prices for industry-specific ETFs, such as XLB (Materials), XLK (Technology), and XLF (Financials), among others.

Data Investigation

In this section, we conducted a thorough investigation of the collected data to understand any underlying patterns, trends, and potential issues that could impact model performance. Key analyses included:

Data Preprocessing

The raw data underwent several preprocessing steps to prepare it for modeling:
  • Data Cleaning: Stocks that had been delisted or were no longer available on Yahoo Finance were removed from the dataset to ensure consistency.
  • Feature Engineering: Additional features were created to enhance the predictive power of the models. These included moving averages, volatility measures, and technical indicators.
  • Data Splitting: The dataset was split into training and testing subsets, with an 80/20 split to allow for robust model evaluation.

Machine Learning Algoritms

kNN Regression

The kNN regression model was used to predict the adjusted close price of the stock based on features such as the opening price, high, low, and volume of the stock. The kNN algorithm works by finding the 'k' nearest data points to the target point and averaging their values to make a prediction. This is how the model was implemented:
  • Feature Selection and Data Splitting: The features selected for the model included the opening price, high, low, and volume, with the adjusted close price as the target variable. The dataset was split into training (85%) and testing (15%) sets without shuffling to maintain the temporal sequence of the stock prices.
  • Hyperparameter Tuning: A grid search was conducted to find the optimal hyperparameters, exploring different values of n_neighbors (ranging from 1 to 21), weights (uniform or distance), and metric (Euclidean, Manhattan, and Minkowski). The best combination found was n_neighbors=7, weights=uniform, and metric=manhattan.
  • Model Performance: Despite the tuning, the model produced a high Mean Squared Error (MSE) of 5421.58, indicating significant deviation between the actual and predicted prices. This large error suggests that the kNN model struggled to capture the volatility and rapid fluctuations in stock prices, making it unsuitable for this prediction task.
Below is the actual versus predicted adjacent close value for Microsoft stock using the kNN Regression algorithm.

Support Vector Regression (SVR)

SVR was utilized to model the stock prices by finding the hyperplane that best fits the data in a high-dimensional space. The SVR model is particularly effective in capturing complex patterns in the data.
  • Normalization: The input features and target variable were normalized using StandardScaler to ensure that the SVR model could effectively handle the data without being biased by the scale of the features.
  • Hyperparameter Tuning: A grid search was performed to identify the best combination of C (regularization parameter) and gamma (kernel coefficient), while fixing the kernel to 'rbf' due to memory constraints. The optimal parameters were found to be C=1000 and gamma=0.001.
  • Model Performance: The SVR model demonstrated outstanding performance, with an exceptionally low MSE of 0.0031. This result indicates that the SVR model was highly accurate in predicting the adjusted close price, with minimal error. Given this performance, SVR emerged as a strong contender for the final model.
Below is the actual versus predicted adjacent close value for Microsoft stock using the SVR algorithm.

Random Forrest Regression

The Random Forest Regression model was applied as an ensemble learning method that combines multiple decision trees to improve predictive accuracy and control overfitting.
  • Feature Selection and Data Splitting: Similar to the kNN model, the features included opening price, high, low, and volume, with the adjusted close price as the target. The data was split in the same manner, maintaining the temporal sequence.
  • Hyperparameter Tuning: A grid search was conducted to optimize parameters like max_depth (ranging from 5 to 15), min_samples_leaf, min_samples_split, and max_features. The best configuration found was max_depth=15, max_features=None, min_samples_leaf=1, and min_samples_split=2.
  • Model Performance: The Random Forest model achieved an MSE of 15.31, which is reasonably good considering the large numerical range of the stock prices. The model's regression confidence was approximately 96%, indicating a high probability that the model's predictions closely align with the true regression line of the data.
Below is the actual versus predicted adjacent close value for Microsoft stock using the Random Forrest Regression algorithm.

Conclusion

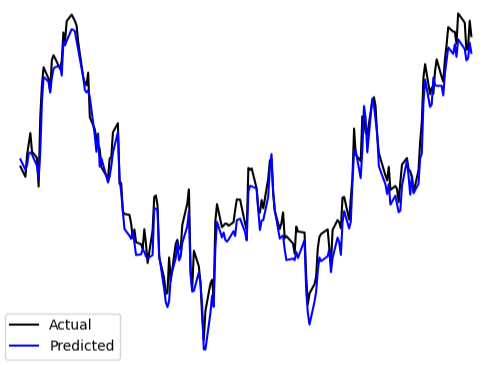
After extensive analysis and model evaluation, we have chosen the Random Forest Regression (RFR) as the final model for predicting stock prices in our project. This decision was driven by several key factors that align with the demands of our dataset and the complexities inherent in financial forecasting.
The Random Forest Regression model demonstrated a high regression confidence of 96%, ensuring its reliability in making accurate predictions across our five-year dataset. Given the volume of data and the non-linear relationships present in stock price movements, Random Forest is certainly the most adapt for this task. It efficiently handles large datasets and is great for capturing complex interactions between variables, such as the relationships between stock price predictors and the adjusted close price.
Another significant advantage of the Random Forest model is its robustness to overfitting. Overfitting is a common challenge in machine learning, where a model may perform well on training data but fail to generalize to unseen data. The ensemble approach of Random Forest, which aggregates multiple decision trees, reduces this risk, ensuring that the model remains effective when applied to new data.
While the Support Vector Regression (SVR) model achieved a lower Mean Squared Error (MSE), the MSE of the Random Forest Regression remains within an acceptable range for our purposes. Considering its strengths in handling non-linear relationships, processing large datasets, and preventing overfitting, we believe the Random Forest Regression model is the most appropriate and reliable choice for this project.
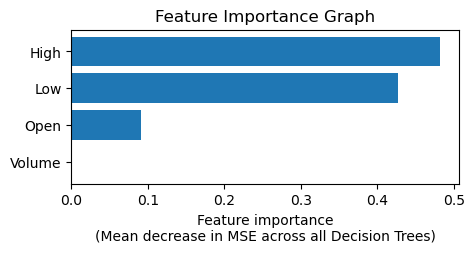
To further support our decision, a feature importance analysis was conducted, revealing that the 'High' stock price is the most influential predictor, accounting for nearly 55% of the importance. This was followed by the 'Low' price at around 40%, while the 'Open' price and 'Volume' had significantly less impact. This analysis not only validates the effectiveness of the Random Forest model but also provides valuable insights into which factors most significantly affect stock price predictions. Below is the feature importance graph.
In conclusion, the Random Forest Regression model stands out as the best-suited model for our stock price prediction task. Its high accuracy, ability to capture complex patterns, and resistance against overfitting make it a reliable tool for financial forecasting. The insights gained from this model can be used for more informed decision-making in stock trading and investment strategies.