Pedestrian Detection

Skills: Data Processing, Python, Machine learning and Computer Vision (YOLOv11), Sensor Data Integration, Autonomous Systems.
This project explores pedestrian detection for autonomous driving by integrating data from 2D LiDAR and RGB camera systems, employing clustering algorithms and deep learning techniques to  indentify pedestrians in diverse environmental conditions.

Objective

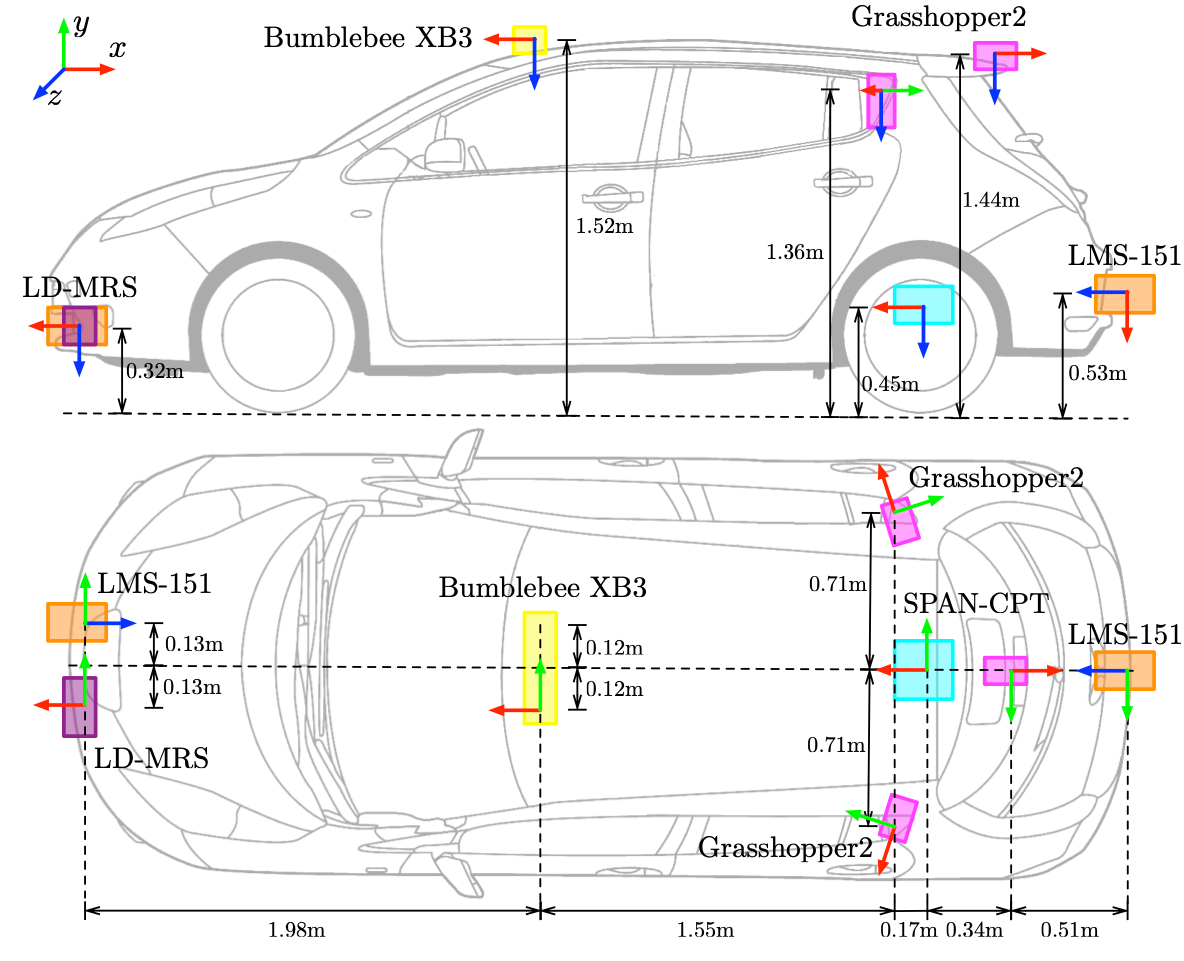
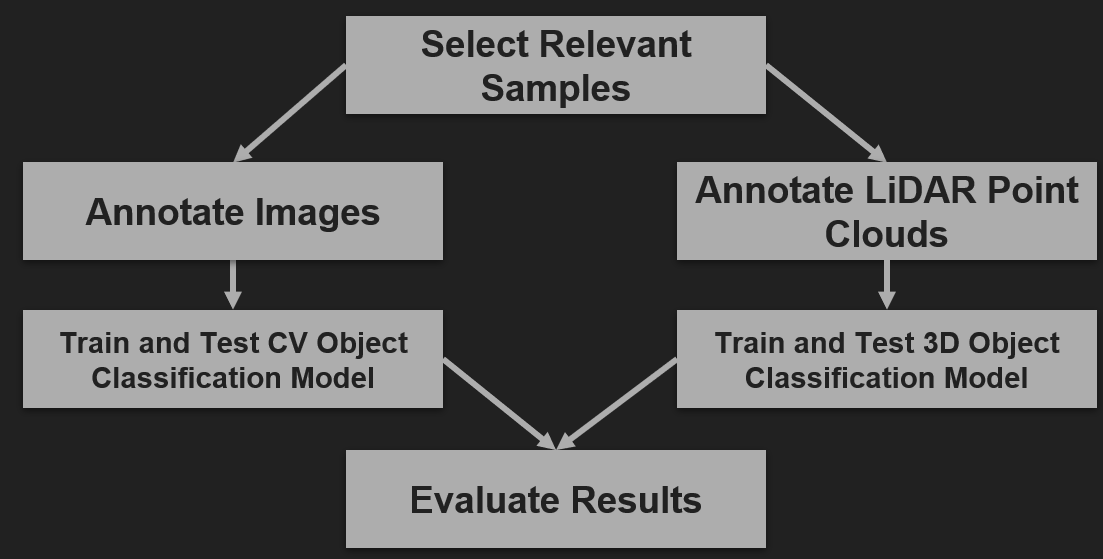
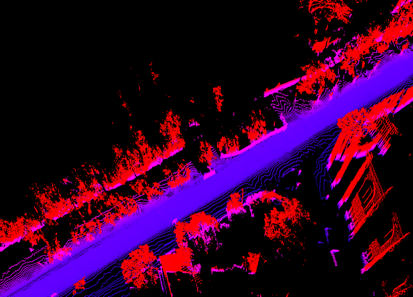
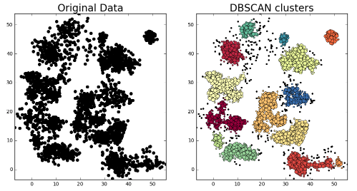
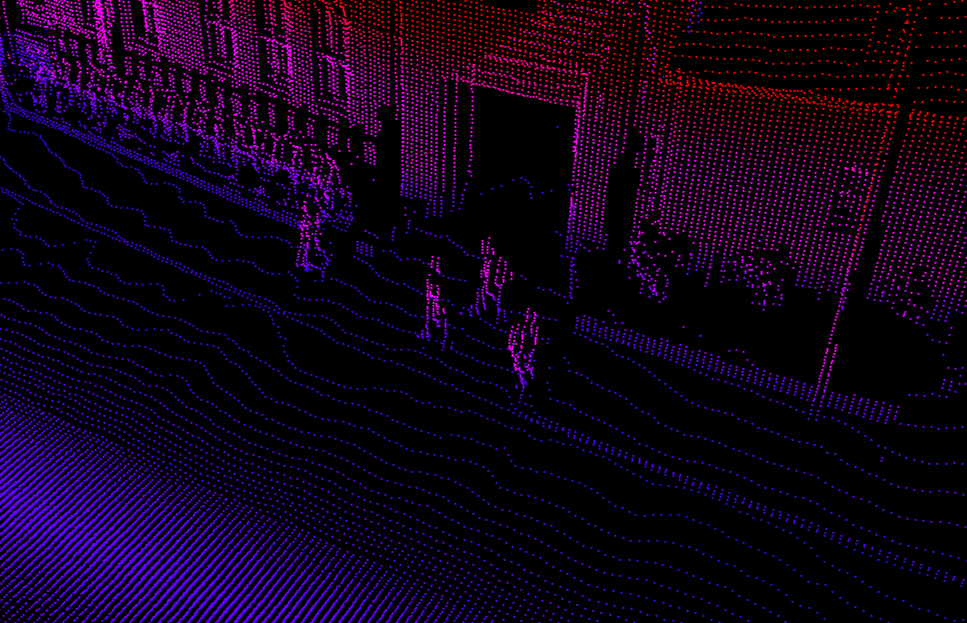
The objective of this project is to evaluate pedestrian detection techniques for autonomous driving by comparing the effectiveness of 2D LiDAR-based clustering and a custom YOLOv11 computer vision model. By integrating data from LiDAR, GPS/INS, and stereo cameras, the project aims to analyze the classification accuracy, robustness, and real-time performance in various environmental conditions, providing insights into the potential for sensor fusion and advanced detection methods in autonomous vehicle navigation.

Data Collection

Data Collection

The data for this project was sourced from the Oxford RobotCar Dataset, which includes over 23 TB of autonomous driving data collected from a Nissan Leaf driving through different paths between May 2014 and December 2015. The dataset has the outputs from multiple sensors, including a 2D LiDAR (SICK LMS-151), a stereo camera (Bumblebee XB3), and a GPS/INS system (NovAtel SPAN-CPT ALIGN). These sensors provide comprehensive environmental information, including LiDAR scans, stereo imagery, and precise localization data. The data collection process from the Oxford RobotCar website is detailed under the "docs" section of the GitHub repo.

Prior to the data selection, the only sensor of interest was the front stereo camera data. This data was comprised of thousands of separate images that could be played back using a script provided by Oxford. With the goal of training and testing the collected data, the team focused on selecting smaller samples of 3 seconds each, ensuring a balanced split across environmental conditions like daytime, nighttime, and various weather scenarios. To perform this data gathering, our team used a Python script found in the data collection folder of the repo, that divided the entire uploaded stereo camera dataset into several randomized data snippets with 45 images each (3 seconds in real-time). The following images show a table with the desired data collection split among the different enviromental conditions and the sensor layout for the car.

Data Selection

The data selection process aimed to identify samples featuring pedestrians or cyclists in the vehicle's direct path, with visibility from the waist up or from the waist down. The RobotCar SDK's video player was used to visually inspect each of the randomized samples for suitability, ensuring there was diversity in the environmental scenarios. This rigorous selection process resulted in 200 distinct samples, with the representation of sunny, inclement, and nighttime conditions as shown in the table above. The data and the timestamps were logged into an Excel sheet making sure that overlapping timestamps were avoided and ensuring GPS availability for accurate localization. With the timestamps at hand, another python script was used to parse through the LiDAR and GPS data, gathering only the data from each of the time intervals in the Excel sheet. The following image shows the desired data work flow after the selection.

Data Annotation and Analysis

Computer Vision

For camera data, RoboFlow AI-assisted tools were used to annotate images with 2D bounding boxes, capturing pedestrians and cyclists in various poses and scenarios. A total of 7740 images were annotated, with all annotations being manually reviewed and edited for accuracy. The following gif shows the reviewing and editing process for the AI annotated images.
The annotated images were then used to train a YOLOv11 model. The dataset was divided into training (70%), validation (20%), and testing (10%) subsets, ensuring a balanced distribution. Data augmentation techniques were used to enhance lighting and exposure on all samples. The training process involved  over 100 epochs on an NVIDIA Tesla T4 GPU via Google Colab, resulting in a model with 864 parameters. The mAP@50 of 0.839 indicated strong model performance on the training dataset. The use of annotated bounding boxes allowed the model to detect pedestrians and cyclists in various situations and environmental conditions, ensuring comprehensive coverage of the dataset's diversity.

LiDAR

The LiDAR analysis focused on point cloud data generated by the SICK LMS-151 2D LiDAR. Initial preprocessing applied primary filtration to remove irrelevant points, such as road surfaces, objects too distant, and points outside the height range for pedestrians (0.5m–3m). Secondary filtration grouped the remaining points into clusters using the DBSCAN algorithm, which identified dense regions of points. These clusters were then analyzed to determine potential pedestrian representation. However, the low resolution of the 2D LiDAR limited its ability to create distinct pedestrian-like shapes, while sparse data and overlapping clusters complicated the classification process. The following images show the comparison between a filtered and an unfiltered LiDAR point cloud.

Original

Filtered

Results

Computer Vision

The custom YOLOv11 model achieved 80% overall accuracy, with 94% specificity and an F1 score of 77%, indicating a strong balance between precision and recall. The model successfully detected pedestrians in both daytime and nighttime scenarios but faced challenges in low-visibility conditions. The F1-confidence curve identified the optimal classification threshold at 0.16, where the model maximized performance. Real-time testing demonstrated an average inference time of 8.4 ms, enabling robust pedestrian detection at a frame rate of 15.6 Hz, making it suitable for real-world autonomous navigation tasks. The following GIFs show snippets of the output video for the machine learning algorithm, with green outlines highlighting the detected pedestrians for both day and night videos.

Day Results

Night Results

The following images depict the confusion matrix and the F1 confidence curve for the results of the machine learning training.

Confusion Matrix

F1 Confidence Curve

LiDAR

The LiDAR approach struggled to produce meaningful pedestrian classifications. Clusters formed by the DBSCAN algorithm lacked clear shapes, making them unsuitable for reliable detection. The placement of the LiDAR sensor restricted visibility directly in front of the car, which also contributed in preventing a comprehensive coverage of pedestrian zones. These noisy and underdefined clusters along with the low resolution datasets, affected the ability to train an effective machine learning model. These challenges underline the limitations of 2D LiDAR for pedestrian detection and highlight the need for higher resolution sensors or enhanced clustering methodologies. The following image shows the DB scan Clusters points based on point density.

DB Scan Cluster by Density

Conclusion

The PeDAL project successfully explored pedestrian detection in autonomous driving by comparing 2D LiDAR-based clustering and a custom YOLOv11 computer vision model. While the LiDAR approach faced significant challenges, including low resolution, noisy data, and difficulties in reliable pedestrian classification, the computer vision model demonstrated a strong accuracy (80%), high specificity (94%), and robust real-time performance. These findings highlight the limitations of 2D LiDAR for pedestrian detection and the potential of advanced deep learning models for real-world applications. Future work should focus on sensor fusion techniques, integrating stereo cameras for better depth perception, and implementing real-time collision detection systems to advance the capabilities of autonomous vehicle navigation in diverse environments.